
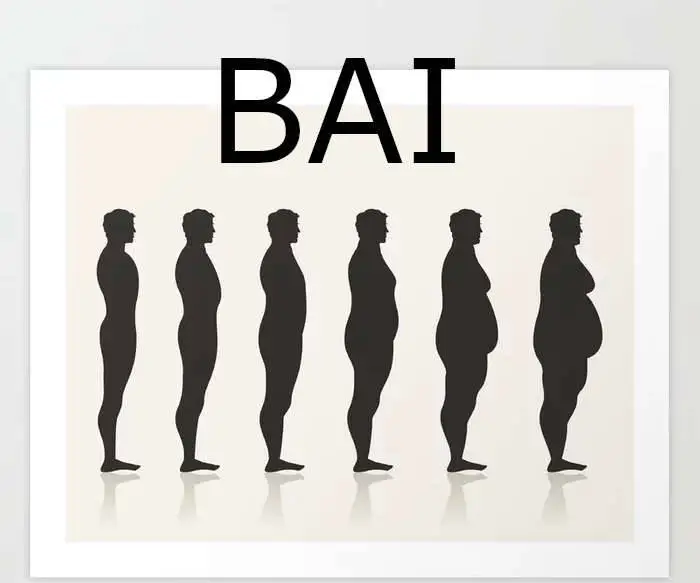
Body Adiposity Index
Body fat index (hip circumference ÷ height 1.5) is not a more accurate measure of obesity than BMI, waist circumference, or hip circumference. Body mass index (BMI) is widely used as a measure of body fat and has been shown to correlate with other measures of obesity. However, its use is limited by differences in body fat at a given BMI by age, sex, and race.
In order to overcome this restriction, samples of Black and Mexican-American people were used to create the body fat index (BAI) by Bergman et al. However, sex-specific data have not been reported and it is not known how well the BAI works in whites. We examined the sex-specific association between both BMI and BAI and body fat in white and black adults.
What is a Body Adiposity Index?
Based on cross-sectional analyses, it has been proposed that hip circumference divided by height 1.5-18 (body fat index (BAI)) can directly estimate body fat percentage without the need for further adjustments for gender or age. We compared the prediction of the percentage of body fat assessed by dual-energy X-ray absorptiometry (PBFDXA), BAI, BMI, and circumference measurements (waist and hip) among 1151 adults who underwent whole-body scanning with DXA and circumference. 1993-2005.
After adjusting for sex, we found that PBFDXA was similarly associated with BAI, BMI, waist circumference, and hip circumference. Overall, BAI underestimated PBFDXA in men (2.5%) and overestimated PBFDXA in women (4%), but the extent of these biases varied by body fat. Adding covariates and degree terms to the body size measures in the regression models significantly improved the prediction of PBFDXA, but none of the models based on BAI could predict PBFDXA more accurately than models based on BMI or circumferences.
We conclude that estimations of body fat percentage derived from the BAI as an adiposity indicator are likely to be skewed, with errors changing by gender and body fat. Although regression models that account for the nonlinear relationship and the effects of sex, age, and race may provide more accurate estimates of PBFDXA, estimates based on BAI are no more accurate than estimates based on BMI, waist circumference, or hip circumference. circumference
Introduction
Although the limitations of BMI are well known, this index is still widely used as a simple indicator of obesity, and adults with a BMI of 30 kg/m2 or more are considered obese. The Body Adiposity Index (BAI), an alternate measure based on height and hip circumference, has recently been proposed:
This relationship was derived from the cross-sectional association of hip circumference (r = 0.60) and height (r = -0.52) with the percentage of body fat calculated by dual-energy X-ray absorptiometry (PBFDXA) among 1,733 Mexican-American adults (61 ). ). ). %, women). A power of 1.5 was chosen to maximize the correlation between hip * length and PBFDXA (r = 0.79) and 18 was the estimated intercept for the linear regression model predicting PBFDXA. It was concluded that the BAI could directly assess body adiposity without the need for further adjustment for characteristics such as gender and age.
However, data presented in a recently published letter suggest that after stratifying by race and sex, BMI may correlate with PBFDXA as strongly as BAI. Also surprising is the use of hip circumference in the obesity index reader. People with a higher hip circumference compared to their body mass index have a lower risk of coronary heart disease and all-cause mortality. In addition, its use as a denominator of the waist-to-hip ratio also suggests a protective effect of a large hip circumference compared to waist circumference.
This simple index of fat distribution has been associated with the development of type 2 diabetes and coronary artery disease, but it is uncertain whether its effect is independent of BMI. The primary objective of this study is to compare the link between PBFDXA and the circumference of the hips, waist, BMI, and BAI. We also investigated whether the prediction of BAI PBFDXA is more accurate than the prediction achieved by other measures of body size. The analysis sample consists of 1,151 adults who participated in studies conducted between 1993 and 2005 at the Body Composition Unit of the Obesity Nutrition Research Center in New York.
Methods and procedures
Methods
Participants were mostly healthy volunteers recruited from the Baton Rouge area for metabolic studies between 1992 and 2011. Only adults with dual-energy X-ray absorptiometry were included in this investigation. Because the focus of the study was on understanding racial differences, race was identified by itself. The Pennington Biomedical Research Center Institutional Review Board approved the study, and participants provided written informed consent.
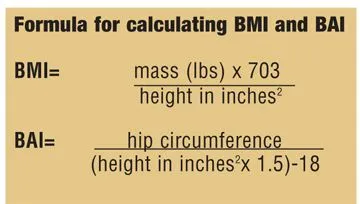
A digital scale was put to use to measure weight, and a stadiometer was used to measure height. The measurement of hip circumference took place at the trochanter level. BMI was calculated by dividing weight in kilograms by height squared, and BAI was calculated by dividing hip circumference in centimeters by height in meters to the power of 1.5 minus 18.
Utilizing the Hologic QDR4500 (n = 1549, 2001–2011) or QDR2000 scanner (n = 2302, 1992–2006) for fat mass and body fat % measurement, QDR2000 data were converted to QDR4500 output (Hologic, Bedford, Massachusetts).
Pearson correlations were calculated between BAI, BMI, fat percentage, and fat mass for both sexes. A linear regression model was used to estimate the relationship between body fat percentage and BAI (or BMI), age, sex, and race. Interaction terms were added to the Gender × BAI (or BMI) and Race × BAI (or BMI) models. Body fat index and BMI were standardized to mean and unit variance before analysis using SAS version 9.2 (SAS Institute, Cary, North Carolina). The level of significance was P < 0.05 and statistical tests were two-sided.
Design and analytical sample
This study is based on cross-sectional data from 1,151 healthy adults (aged 18-110 years) who participated in 1 of 11 studies conducted at the Body Composition Division of the New York Obesity Nutrition Center. Between 1993 and 2005, the study participants were evaluated (mean 1997). Written informed consent was obtained for all studies and approved by the St Luke’s-Roosevelt Hospital Radiation Safety Committee and Institutional Review Board.
Subjects were included in this analysis if they were healthy and active, had no known diseases affecting body composition, and had a whole-body DXA scan to determine percent body fat (PBFDXA) and hip circumference. Among the 1151 subjects included in the current analyses, data were missing for any of the characteristics studied. Surveys, anthropometry, and laboratory procedures
Race-ethnicity was based on self-reported data and included information on race-ethnicity of parents and grandparents. Subjects in this study were classified into five categories: white (37%), black (27%), Hispanic (25%), Asian (8%) and “other” (3%). Approximately 75% of subjects classified as Hispanic reported having family in Puerto Rico or the Dominican Republic. Asians were mostly Japanese, Chinese, or Korean. Weight was measured on a scale to the nearest 0.1 kg, and height was measured with a wall-mounted stadiometer to the nearest 0.1 cm. The participants donned hospital gowns.
Waist and hip circumferences were measured using a strong, non-flexible plastic fiber measuring tape placed directly on the skin at the level of the iliac crest (for the waist) and at the maximum extension of the buttock (hip). Intraclass correlations for repeated measures of the body composition unit were >0.99 for both waist and hip circumferences. The math behind the calculation of BAI was done as follows: (hip circumference (cm) ÷ height (m) 1.5) – 18. BAI estimates for body fat percentage in this study ranged from 13 to 45% for men and 16 to 60% for women. Software versions 1.3 and 1.5 of Lunar DPX or 3 and 4 of Lunar DPX-L were used for DXA scans.
Quality control of fat and fat-free mass measurements was assessed using water (coefficient of variation = 1.5 to 1.6%) and alcohol (coefficient of variation = 0.6 to 1.3%) soft tissue phantoms. Total body fat (kg) divided by total body mass (as determined by the scanner) yielded the PBFDXA. As previously reported, the equation PBFDXA-L = −0.5532 + 0.9813 × PBFDPX was used to convert DPX estimates to comparable DPX-L values. The article uses DPX-L estimates of body fat percentage. Both models were validated to measure fat mass, lean mass, and bone mineral content using the 4-compartment model as a reference.
Statistical analyses
Because BAI has been suggested to be a better index of adiposity than BMI, analyses focused on comparing the associations of PBFDXA with BAI and BMI. To find out if these traits are as strongly linked to body adiposity as BAI, we also looked at the relationship between PBFDXA and hip and waist circumferences. All analyses were performed using R. Variations in correlation magnitudes with PBFDXA were compared more than once. For example, to determine whether PBFDXA was more strongly associated with BAI levels than BMI, we examined the difference between (i) the correlation between PBFDXA and BAI and (ii) the correlation between PBFDXA and BMI.
Because BMI and BAI are correlated, we assessed the statistical significance of this difference using correlation coefficient tests. the null hypothesis is that the two correlations with PBFDXA are identical. The question of whether waist and hip circumferences were as substantially related to PBFDXA as BAI was tested using similar methods. Several results were confirmed by retesting the boot. To adjust for gender and age, we calculated correlation coefficients with residuals from linear models regressing different body sizes on gender and age. P< A value of 0.01 was used to assess statistical significance.
To assess whether the BAI can accurately assess PBFDXA, we first scored the levels of both features for each subject. Bland-Altman plots were then constructed by plotting the observed differences (BAI – PBFDXA) against the mean of the two traits. A smoothed lower curve has been added to each graph to show the pattern of these differences. We also compared the ability of different complex regression models to predict PBFDXA for each body size. These models included age, gender, and race as extra factors.
R2, the mean absolute difference between the expected and actual values of PBFDXA, and the standard error (root mean square error) of the residual are reviewed.
The Score
315 black men, 1,262 white men, 812 black women, and 1,462 white women consisted of the sample for this study. Mean age, BMI and body fat percentage of the sample were 41.0 (13.4) years (range 18-69 years), 29.4 (6.1) (range 17.2-57.7), and 32.0% (9.7%) (between 7.8 and 55.9%).
The four sex-race groups showed relationships with fat percentages ranging from 0.75 to 0.82 for BAI and 0.80 to 0.83 for BMI, as well as correlations with fat mass ranging from 0.90 to 0.96 for BMI and 0.77 to 0.86 for BAI.
The regression model including BAI explained 81.9% of the variance in fat percentage. The corresponding BMI model explained 84.1%. For both mean BAI and BMI, body fat was 5.2% and 12.2% greater in women than in males (P < 0.001), while whites had 0.7% and 1.6% more body fat than blacks (P < 0.001). with BMI and BAI averages, respectively. The race interaction term was not significant for BAI (P = 0.19) but was for BMI (P < 0.001); however, both gender interaction terms were significant, indicating that the associations between BAI and BMI with percent body fat varied by gender and race in relation to BMI.
Descriptive characteristics of the sample are presented in Sect. The mean age was 45 years (men) and 48 years (women), and 15% of men and 36% of women were obese (BMI ≥30 kg/m2). Compared to women, men had significantly lower mean levels of PBFDXA (21%, men vs. 35%, women) and BAI (24, men vs. 33, women). Women’s higher BAIs were due to their greater hip circumference (97 cm, men vs. 102 cm, women) and shorter height. Overall, 37% of the subjects were white, 27% were black, and 25% were Hispanic.
The relationship between anthropometric characteristics is shown in the figure. In analyses with men and women together (n = 1151), PBFDXA correlated more strongly with BAI (r = 0.86) than BMI (r = 0.74) and both hips (r = 0.76). ) and waist circumference (r = 0.55); P< 0.01 for each comparison. (The null hypothesis was that the magnitude of the correlation between PBFDXA and BAI was the same as that between PBFDXA and the other three traits.) Furthermore, an analysis of all 1151 subjects showed that PBFDXA was almost as strongly related to height (r). = −0.43) as was the case for weight (r = 0.47).
Yet, stratified analyses revealed that sex-related confounding was mostly to blame for the larger correlation between PBFDXA and BAI. There were few differences between PBFDXA and BAI, BMI, or circumferences separately for men and women, with correlations ranging from r = 0.75 (hip circumference) to r = 0.80 (waist circumference) and r = 0.81. (waist) r = 0.85 (BMI) in women. Based on the test of equality of these correlation coefficients, it was estimated that the only association with PBFDXA that was significantly different from BAI was the association between PBFDXA and BMI.
When comparing BMI in women, PBFDXA had a stronger correlation (r = 0.85 vs. r = 0.82); the difference was significant (P<0.01). The magnitude of the association between PBFDXA and height was also significantly reduced in these stratified analyses. Comparisons of both sex and age showed that adjusted PBFDXA levels were more strongly correlated with BMI than with BAI (r = 0.80 vs. 0.76, P and lt; 0.01 for difference). The difference between the two correlation coefficients was most pronounced in women (r = 0.78 (BAI) and r = 0.82 (BMI)), while the difference in the male associations was small.
Analyzes stratified by age showed that BMI was at least as strongly associated with PBFDXA as BAI, with statistically significant differences between those aged 18–34 and those aged 60 and over (rBMI > rBAI). Also, PBFDXA was more strongly associated with BMI than BAI among both whites and blacks. None of the comparisons showed that PBFDXA had a stronger association with BAI than with BMI or circumference. In some groups (blacks, whites, and older people), hip circumference correlated more strongly with PBFDXA than BAI. For 383 men and 768 women, it displays the BAI and PBFDXA values. If the BAI provided an unbiased assessment of body fatness, scores would be symmetrically distributed around the line of identity.
Though the differences differed by gender, the overall standard deviation of the difference between BAI and PBFDXA was 6.3%. In men, the mean difference (BAI — PBFDXA) was 3.9%, but in women, the mean difference was -2.4%. The use of the BAI to assess PBFDXA also varied by body fat level, with overestimation of percent body fat by the BAI most evident when body fat is low. Percentage of body fat calculated by dual-energy X-ray absorptiometry (PBFDXA) and body fat index (BAI) (x-axis) in men (left panel) and women (right panel), where the diagonal line indicates the line of identity (PBFDXA = BAI).
If the BAI were a good and unbiased estimator of PBFDXA, the scores would cluster around the detection line with no discernable pattern. The agreement between BAI and PBFDXA is further explored in Bland-Altman plots, where the difference (BAI – PBFDXA) vs. the mean is plotted for each individual. Although BAI overestimated PBFDXA in men overall, the overestimation was greater than 10% in men with low body fat, but almost 0 in men with more than 25% body fat. (Lines are loess curves showing smoothed estimates of the difference by body fat level. .) BAI also overestimates in low body fat female PBFDXA but underestimates PBFDXA (scores below years = 0 in the figure) moderate to high. Amounts All things considered, 75% of men and 70% of women had PBFDXA exaggerated and underestimated by BAI.
Bland-Altman plot for difference (PBFDXA – BAI, in years) versus mean (PBFDXA + BAI, x‐axis); men are on the left and women on the right. The fitted line has been loess smoothed and shows the estimated difference (BAI – PBFDXA) at each body fat level. Horizontal lines indicate 0 difference and 95% confidence intervals for the observed difference. The solid triangle shows the average body adiposity (based on the two variables) and the average difference (BAI – PBFDXA). BAI, body adiposity index; PBFDXA, percentage of body fat calculated by dual-energy X-ray absorptiometry. Examines the predictive accuracy of PBFDXA using four body measurements (BAI, BMI, and two circumferences) in different regression models.
In models based on only one linear term for each body size measure, BAI was the strongest predictor of PBFDXA with an R2 of 0.74. (However, estimates of hip circumference and height 1.5 for this model were −31 (intercept) and 1.28 (slope), values that differ significantly from Bergman et al. (−18 and 1.0). Different males and females. With several R2 values ranging from 0.77 (waist circumference and BAI) to 0.79 (BMI), intercepts lessened the disparities between body size measures.
However, examination of the residuals showed that the errors varied with body fat level, and therefore nonlinear terms were added to, which slightly increased R2 Subsequent inclusion of age and race/ethnicity further increased R2 values, with the highest R2 values observed for BMI (0.84–0.85). Among the different models, models based on body mass index or hip circumference were better (p < 0.01) predictors of body fat percentage than the model including BAI.
Discourse
Our results show that BAI correlates more strongly with PBFDXA than BMI only in analyses where gender or age cannot be controlled. Stratification by gender eliminated this difference, as PBFDXA was similarly related (r = 0.75-0.80 for men and r = 0.81-0.85 for women) to BAI, BMI, waist circumference, and hip circumference. That BAI was not more significantly linked with PBFDXA than these other measures of body size was verified by additional age adjustment.
Although the differences in the size of correlations with PBFDXA were relatively small, in several cases (eg women) the observed correlation with BMI was stronger (p < 0.01) than with BAI. Although it has been argued that the BAI can provide an estimate of body fat percentage without further adjustment, our results show that these estimates are systematically influenced by gender and level of adiposity. On average, the BAI overestimated PBFDXA by 4% in men and underestimated PBFDXA by 2.5% in women, quite similar to subjects in Fels’ longitudinal study.
Although BAI was found to underestimate PBFDXA by approximately 7% among 132 women, this may have been due to their high BMI values (mean 35.0 kg/m2). Because biases associated with BIA vary considerably with body fat level, gender differences between studies are expected to vary somewhat with study-specific levels of fatness. It is also worth noting that the BAI weight in estimating body fat percentage according to Bergman et al. varied by level of fatness but was not discussed.
The simplicity of the BAI was also emphasized, but it is uncertain whether the calculation of percent fat (hip circumference (cm) ÷ height (m) 1.5) – 18 is easier than estimating body fat using regression models. Our findings, for instance, indicate that PBFDXA could be predicted more precisely than BAI if 13.6 (for men) or 1.5 (for women) were subtracted from 1.32 × BMI. However, if hip circumference ÷ height 1.5 is desired to predict PBFDXA, our results show that the best fitting estimates of regression lines are -31 (intercept) and 1.28 (slope), which are significantly different from the reported values (-18 and 1.0 ), Bergman et al (Bergman ’11), but very similar to the Fels study (-33 and 1.26).
Prediction of percent body fat from either BAI or BMI (only in linear terms) should be interpreted with caution, as estimates are likely to vary systematically with body fat levels. These findings extend previous studies in adults showing that (i) BAI is less strongly related to skinfold thickness and risk factors (lipids, insulin, glucose, and blood pressure) than BMI, and (ii) hip circumference is equally strongly correlated with skinfold thickness. . and risk factors such as BAY.
It’s possible that the hip circumference and BAI in this study have comparable relationships because of the modest associations between adult body fat and height that we and others have found.
The ideal adult adiposity index is thought to have little relationship with height. This has long been believed. As suggested by Schulze and Stefan, it is likely that the original derivation of the BAI was heavily confounded by gender. The potential for confounding is underscored by our results, as well as an analysis of 3,851 Baton Rouge adults, which found that PBFDXA correlated more strongly with BAI than BMI in an analysis combining only men and women. The mixed effects of Bergman et al. Furthermore, PBFDXA seems to have a stronger correlation with height (r = −0.52) than with weight (r = 0.23).
Although the inverse relationship between PBFDXA and height led to the standardization of hip circumference for height, this relationship was based on analyses where men and women were grouped together. Because women tend to be shorter and have more body fat than men, analysis of the relationship between height and body fat overestimates the strength of the relationship. For example, in this study, the correlation between height and PBFDXA was r = −0.43, but associations decreased with |r| of 0.10 in age-adjusted sex-specific analyses.
Similar associations were observed in NHANES 1999-2004 (D.S. Freedman, unpublished data), where height was inversely correlated with PBFDXA (r = −0.50) among all adults (n = 12,957), while sex-specific correlations of r = – 0.02. (males) and r = -0.10 (females). Body fat analyses, which do not control for sex, should be interpreted with extreme caution. This study has several potential limitations. Our sample is not representative of the general population, and BMI and hip circumference were lower than Bergman et al.
Furthermore, although DXA estimates of body fat are highly correlated with methods such as the 4-compartment model and neutron activation, there can be large variations between individual subjects. DXA estimates of body fat percentage can also vary by manufacturer and model. Estimates of body fat can also vary systematically, with DXA underestimating body fat in lean subjects and overestimating body fat in obese subjects. Although the use of two different feather DXA systems in this study probably introduced additional errors, a previous study found good agreement (CV = 4.4%) in fat mass estimates between the two systems.
Although there may also be differences in measurements of hip circumference, the measurements in this study and Bergman et al. In conclusion, we found that after accounting for differences in body fat between men and women, PBFDXA did not correlate more strongly with BAI than BMI, waist circumference, or hip circumference levels. Although the differences between these measures of body size compared to PBFDXA were relatively small, in several cases the adjusted associations with BMI or hip circumference were significantly (P < 0.01) stronger than those for BAI. If accurate weight measurement (and BMI calculation) is difficult, circumference measurement can be considered, but there is no advantage to using BAI over waist or hip circumference.
To comment
Body mass index and BAI work similarly in predicting body fat. Within each sex-race group, the associations between BMI and BAI as well as % fat and fat mass were similar. In addition, regression models including BAI or BMI explained the percentage of variation in body fat percentage. The interpretation of BMI, body fat percentage, and BAI in various groups is complicated by variations in gender and race.
Our results are based on a sample of volunteers who participated in clinical trials, and the representativeness of the results is unknown. Neither BMI nor BAI directly measures the complications of obesity, and further research is needed to determine the clinical relevance of these measures.
FAQs
What is the index of body adiposity?
The recently developed clinical measure known as the Body Adiposity Index (BAI) is based on the hip circumference to height ratio to the 1.5 power minus 18 (cm/[(m)1.5 − 18]), which has a strong correlation with the percentage of body fat (% fat).
What is the average body fat percentage?
For women between the ages of 20 and 39, a target body fat percentage range is 21% to 32%. Men ought to make up 8% to 19%. Women should make up between 23% and 33% of the population aged 40 to 59, while men should make up between 11% and 21%. Women should have 24% to 35% body fat and men should have 13% to 24% if they are 60 to 79 years old.
What is the adiposity measurement formula?
To calculate the body adiposity index, multiply your height (in meters) by the square of your hip circumference (in centimeters) and subtract 18 from the result. where the measurements for height and hip circumference are in meters and centimeters, respectively.
References
- Freedman, D. S., Thornton, J. C., Pi‐Sunyer, F. X., Heymsfield, S. B., Wang, J., Pierson, R. N., Blanck, H. M., & Gallagher, D. (2012, December 1). Obesity. https://doi.org/10.1038/oby.2012.81
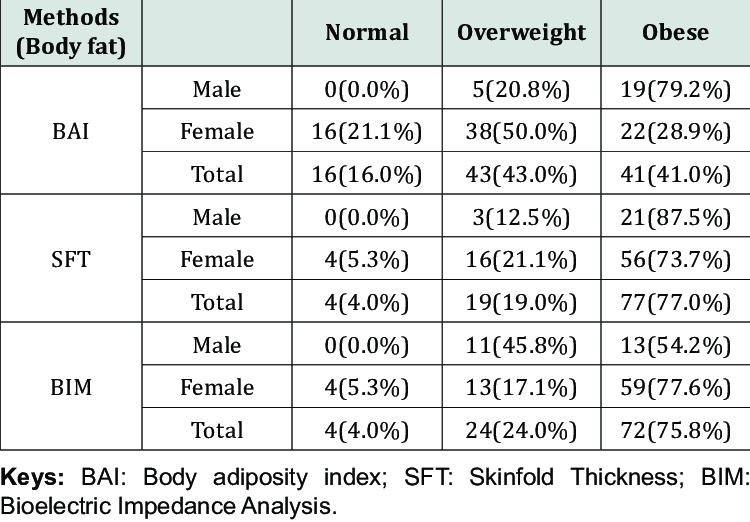
- Image- Classification-of-the-participants-using-the-age-group-adjusted-body-fat-percentage.png (750×522). (n.d.). https://www.researchgate.net/profile/Jeneviv-John-2/publication/333458118/figure/tbl2/AS:764014728589314@1559166714742/Classification-of-the-participants-using-the-age-group-adjusted-body-fat-percentage.png